Cindy Ord
The dividend is the main reason investors choose to invest in Telecom giants like Verizon (NYSE:VZ) or AT&T (T). Verizon is currently experiencing a very significant drawdown of 30%, a rare sign for a stable company, and has a dividend yield of 6.8% versus its average of 4.75%. This article will dive into the numbers Verizon and see if the dividend is well covered or if a potential Dividend cut is imminent. In light of recent dividend cuts from Intel (INTC) and VF Corp. (VFC), the latter of which I called out in a timely article, it is vital to review this for high-yielding stocks like Verizon.
Dividend Grades
We can see that Verizon scores pretty well in all categories, with no red flags. Let's dig into the numbers.
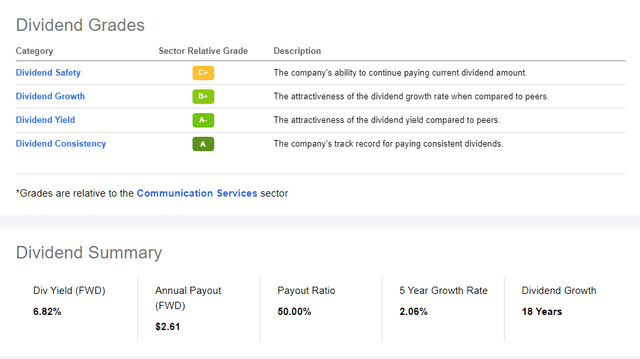
Verizon Dividend Grades (Seeking Alpha Premium)
Dividend Growth, Yield, and Consistency
These three parts of the dividend will be the more minor focus of this article.
Growth
I think Verizon's dividend growth looks much worse than the B+ Seeking Alpha awards it. Verizon underperformed its peer group in practically every single category here. The company has shown a consistent dividend increase of around 2% over the last year, the previous 3, 5, and 10 years. The expected forward growth rate comes in even lower at 1.47%. Most metrics show a difference to the peer group of between -20% and -50%.
| Timeframe |
Compound Annual Growth Rate (CAGR) |
Sector Median |
| Next year expected | 1.98% | 3.61% |
| Last one year | 1.97% |
4.26% |
| Last three years | 2.01% | 2.57% |
| Last five years | 2.06% | 2.85% |
| Last ten years | 2.45% | 0.14% |
Source: Author, with data from Seeking Alpha
Yield
While Verizon can't show much growth, it does score very well in the Yield category. Verizon has a 4-year average yield of 4.75%, 45% above the peer group, and currently, is at a strong 6.76% dividend yield. This strong yield might be a good trade-off. In every category, Verizon outperforms its peer group here.
Consistency
Verizon has an excellent track record compared to its peers. It's hard to find a good track record in the capital-intensive telecommunications industry, as shown last year when AT&T cut its dividend together with its Warner Bros. Discovery (WBD) spin-off. Verizon has a strong 18-year streak of raising the dividend (even if it's just minor increases over the last 18 years, it added up to a doubling of the dividend per share) and 22 years of dividend payments.
Dividend Safety
High dividend yields only mean something if the dividend can be sustained and doesn't have to be cut or paid by rising issuance of Debt or shares. First off, let's look at some data and then go into detail:
| Criteria | Verizon | Sector Median |
| EPS GAAP Payout ratio | 51.09% | 37.04% |
| EPS Non-GAAP Payout ratio | 50.00% |
36.13% |
| Cash Flow Payout ratio | 29.61% | 24.06% |
| FCF Payout Ratio | 76.88% | 31.11% |
| Net Debt/EBITDA | 280.27% | 235.43% |
We can see that Verizon lags behind its peers in all metrics. Let's look at the payout first. Generally, the higher payout ratio is okay, considering the significantly higher dividend yield. While many people like to look at EPS payout ratios, I prefer cash flow ratios because the dividend is paid by hard cash, not by accounting profits.
Cash Flow Analysis
Below, you can see the last 10 years for Verizon. Revenues grew modestly by an average of 1.68% to $136 billion, in line with Cash from Operations at a 1.67% average growth. We can see that the business is very stable, generating an enormous $35 billion in median Operating Cash Flow. We can also observe that Free Cash flow has been more volatile and is currently significantly below the median of $17.3 billion, at just $14 billion over the last year. This is a function of the increased Capital Expenditures over the previous years. After the company acquired C-Band for $52.9 billion in March 2021, we see that CapEx increased meaningfully. Verizon expects to reduce its Capital Intensity back to levels seen before the acquisition, so we can expect CapEx to drop back around its median of $17.2 billion versus the current $23 billion. This will give a meaningful push to Free Cash Flows, which then should follow Operating Cash Flow back above its long-term median. The coverages shouldn't be at risk with Dividend payments of $10.8 billion.
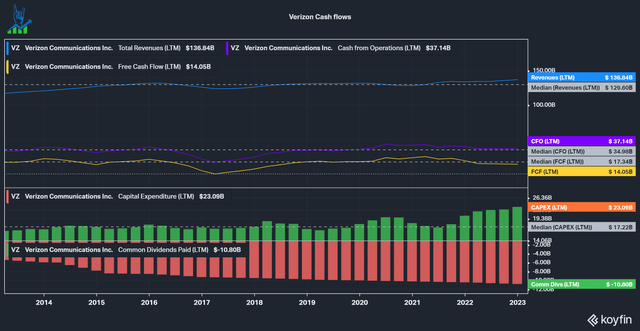
Verizon Cash flows (Koyfin)
Debt Analysis
The telecommunications industry is a very capital-intensive industry and as a result, most players in it are highly levered. Below, we can see that Verizon currently has $178 billion in net Debt (just $2 billion being cash and short-term investments) and a net debt/EBITDA leverage ratio of 3.2x. The company pays $3.32 billion in interest annually, an interest rate of just 1.8%. It is essential to look at the company's maturity profile to see how much Debt has to be rolled over, most likely at a higher interest rate. Within a year, the company has to refinance almost $10 billion and around ~$42 billion of Debt must be refinanced by the end of 2028. This should push the interest rate higher, but not much does to the stable cash flows and decent credit ratings Verizon has. Interest shouldn't get out of control. However, the company isn't happy with its leverage and wants to reduce it to 1.75-2.0 times (measured as net unsecured debt/Adjusted EBITDA). Unsecured Debt is around $120 billion and the adjustments to EBITDA aren't too significant and mainly account for other profits like investment fluctuations according to GAAP) by 2028. This would mean the company has to pay down about $20 billion in debt if we take their unsecured Debt and assume that EBITDA will remain stable at around $50 billion, as it was in the last decade. If Verizon gets back to $17 billion in FCF and pays out about $11 billion, we have $6 billion of excess FCF a year to pay down the Debt. Thus, Verizon should generate ~$30 billion of FCF until 2028 that can be used to pay down this Debt, more than the $20 billion it wants to pay down. Overall, this looks like a very achievable goal and a good capital allocation.
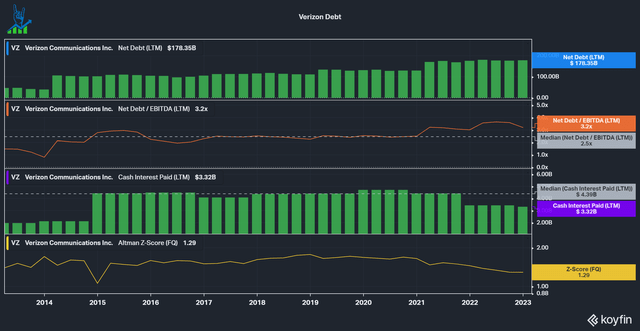
Verizon Debt Analysis (Koyfin)
Latest Quarterly Results are Reassuring
Let's look at the latest quarter. The company reported Q4 in mid-January and managed to beat revenue estimates with EPS in line. The results are good, and the market liked them as well, pushing the stock up slightly with an overall flat market. Q4 is encouraging that Verizon is on the right track, with revenues up 3.5% in the quarter and 2.4% for the full year, beating their 10-year revenue growth median of <2%. Verizon's 2023 guidance was perceived as weak by some analysts, but to me, it is especially reassuring to see the guidance for Capital Expenditures in line with its Investor Day statement to get back to pre-C-Band CapEx levels. This will materially help free cash flow with a CapEx reduction of $4-$5 billion.
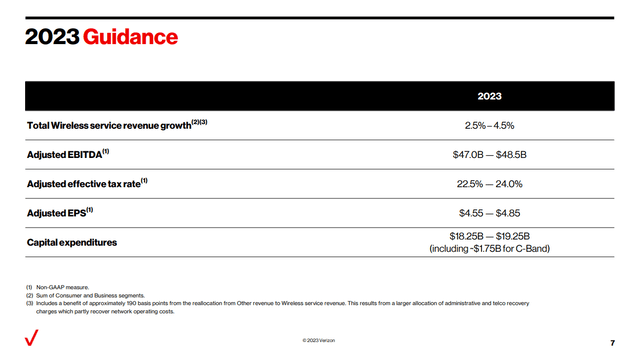
Verizon 2023 Guidance (Verizon Q4 Report)
Valuation
Verizon currently trades below its median PE and EV/EBITDA multiples but doesn't look as good on FCF yields because of the depressed FCF we discussed above. In its 2022 Investor Day, the company guided for 4% revenue growth and higher EBITDA growth due to margin improvements in 2024 and beyond. Based on its stagnation for the last decade, I'd be cautious with these assumptions. The company also talked about Buybacks, something they haven't done in the previous decade (they repurchased $5 billion, but that only offset $5 billion of Stock-based compensation), which could help the stock. Overall, I think that Verizon could be a decent opportunity right now for a portfolio focused on income, i.e., to fund a retirement. Total returns probably won't be impressive, but at a 7% dividend yield with a pretty safe dividend, there isn't too much one could do wrong here.
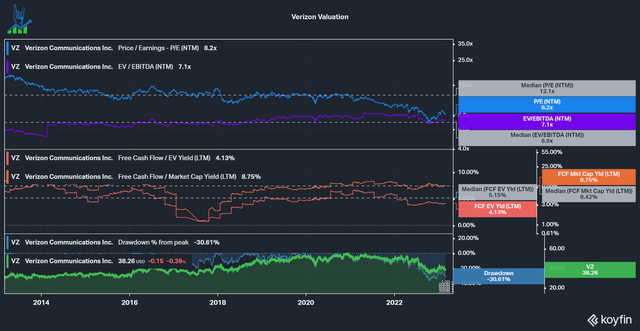
Verizon Valuation (Koyfin)
"corp" - Google News
March 06, 2023 at 10:00PM
https://ift.tt/2VRrs1Q
Will Verizon Cut The Dividend Like Intel And VF Corp? (NYSE:VZ) - Seeking Alpha
"corp" - Google News
https://ift.tt/Ydhb7Hj
Shoes Man Tutorial
Pos News Update
Meme Update
Korean Entertainment News
Japan News Update
Bagikan Berita Ini


0 Response to "Will Verizon Cut The Dividend Like Intel And VF Corp? (NYSE:VZ) - Seeking Alpha"
Post a Comment